The idea is not to create graphics charts from PHP. It will take considerable processing and data transfer size. Therefore, client side charting is the choice. Javascript is the only scripting language on a browser that does not require plugin so it will do.
The last thing to consider is what type of graphics to use to draw the chart. I have used SVG before to create charts. It is nice but I would like to make use of HTML5 canvas element to do it instead. So I finally settled with canvas graphics.
PHP can talk to javascript via AJAX. I too have done it before but the chart I am doing is not real time dynamic data. Thus, PHP is used to create javascript code. There isn't much javascript code to generate to create a chart if you use a javascript chart module that is easily available.
There are plenty of Javascript charts available. Some offer 90 plus type of charts. Since the requirement is probably just Line, Bar, and Pie, The consideration is to get the smallest size module to do the simple work.
Most popular Javascript charts is actually using HTML although the name is Javascript Chart. They even use ".js" as file name. I find it troubling as they actually requires access to the remote site to get the JS source. It also uses "crossorigin" links to JS source. The worst of all is that even the JS file cannot be downloaded locally. Three of the most popular JS chart module I tried cannot even be run on local directory.
I did a considerable search around internet and finally settled with Rgraph. It is a true JS library module and can be downloaded to run locally. The graphic is simple and not as elegant but it works.
The user JS to generate a charts is very simple. You can see it as below
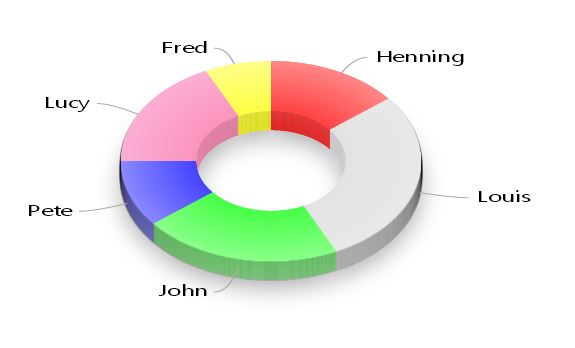
    var pie = new RGraph.Pie({
        id: 'cvs3',
        data: [4,8,6,3,5,2],
        options: {
            shadow: true,
            shadowOffsety: 7,
            shadowBlur: 25,
            strokestyle: 'rgba(0,0,0,0)',
            labels: ['Henning','Louis','John','Pete','Lucy','Fred'],
            clearto: 'white',
            variant: 'donut3d',
            labelsSticks: true,
            labelsSticksLength:25,
            radius: 100
        }
    }).draw();
All you need to do is change the "data" and the "labels" option. Getting PHP to generate the two parameter is very easy.
Construct the data in the appropriate format in php and use the following line to replace the data line in JS.
data:<?php echo $data; ?>,
The other change is the Labels line
labels:<?php echo $label; ?>,
That's all. The chart will come out beautifully.
If you want to get the chart to be much more interactive and vibrant, the Rgraph documentation will show you very much more options to set the graphs. Below is a picture of a donut pie chart from the Rgraph examples above.

No comments:
Post a Comment